In this exercise, we’ll build a new presentation based on the visualizations and slicers we built in the Discover chapter. Before you get started, launch Present to open a new presentation.
STEP 1
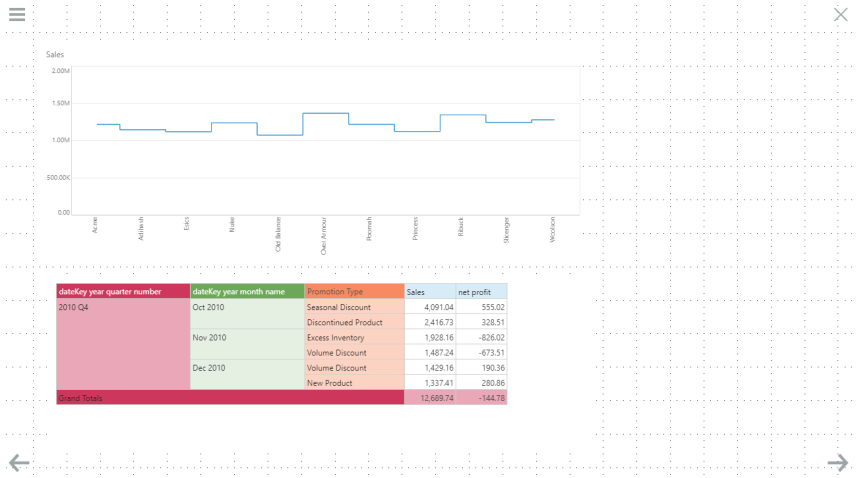
In the Content panel, open My Content, and drag USA Top Promotions in Q4 Grid onto the canvas. Resize the visual so that all rows and columns are visible. Then drag the Sales by Manufacturer Line Chart onto the canvas.
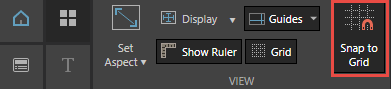
NOTE: Go to the home ribbon and turn on Snap to Grid, to easily align visuals to the gridlines.
STEP 2
Select New from the home tab, and then add the Sales by Manufacturer Area Chart, and the Product Promotions Sales Grid to the second slide.

STEP 3
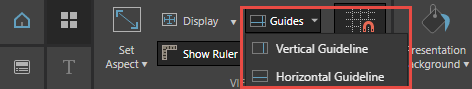
Click on Slide 1 in the Preview panel to return to the first slide. Go to the Presentation ribbon and open the Guides Menu. Add a Vertical Guideline, and then a Horizontal Guideline.
STEP 4
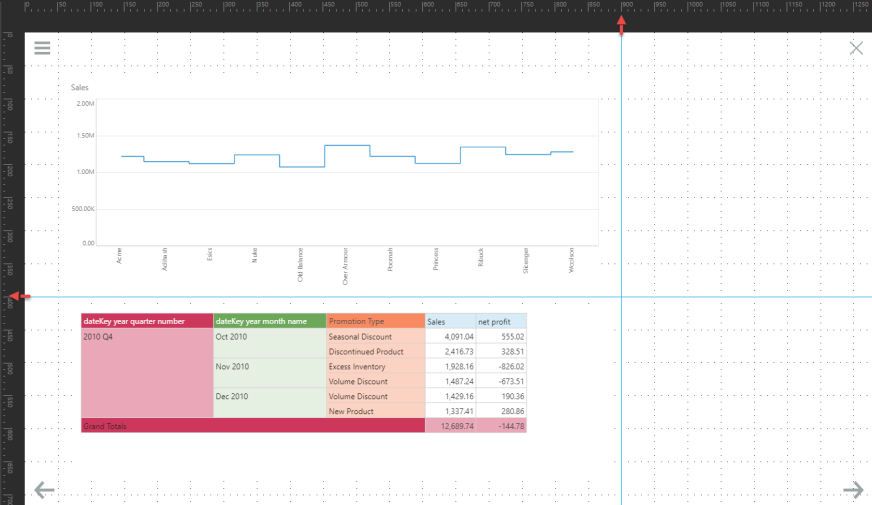
Drag the vertical guideline out to 900 mm on the ruler, and drag the horizontal guideline down to 400 mm. Position the visuals accordingly.
STEP 5
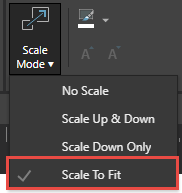
Click the grid, and from the Component ribbon open the Scale Mode options and select Scale to Fit.
STEP 6
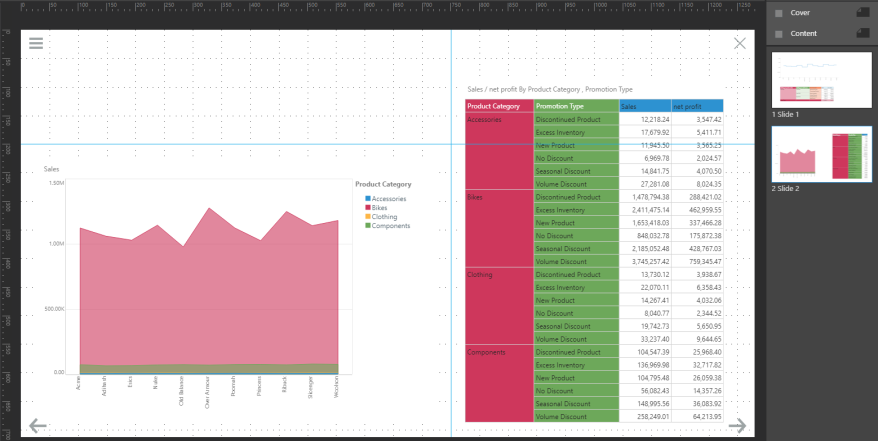
Click the Next arrow at the bottom of the canvas to open the second slide. Position the guidelines and visuals as desired.
NOTE: To turn of the guidelines, go back to the presentation ribbon and deselect the Guides button.
STEP 7
Save your presentation in My Content as Sales Presentation.

NOTE: To learn about adding slicers your slides, see Presentation Slicers and Interactions.